The Gantt chart gets its name from Henry Gantt who was an American mechanical engineer as well as a mechanical engineer.
A Gantt chart is a chart that illustrates the milestones achieved during a project as well as their start and finish dates in the form of flowing horizontal bar charts. In this chart, the horizontal axis shows the sequence of time while the vertical axis shows the tasks that need to be completed.
It also illustrates the relationship between different tasks as well as the current schedule status of the project. It is an ideal tool for planning as well as executing a phase of your project as it gives a visual and easy to comprehend timeline of the tasks as well as the assigned resources.
Gantt charts also allow you to efficiently manage your projects because each task can be color-coded by the individual member, function, or team. Thus, the dependent tasks can be tracked easily.
Download: Project Implementation Plan
Using a Gantt chart, you can compare the schedule and plan of your project against the actual progress. It can also be used to define the key milestones achieved and also to view the baselines and critical paths of the project.
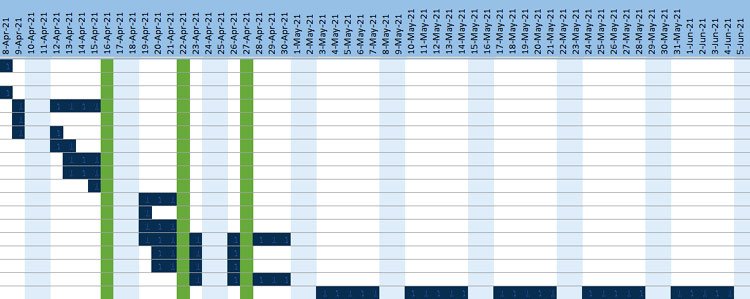
Gantt Chart with Milestones Excel Template
Usually, milestones are a part of Gantt charts and are represented as such. However, in case a high-level overview is required, milestone charts are used.


This is an easy way to illustrate as well as schedule the important milestones in your project. These charts provide a glimpse of your project which can be used in an important presentation as well as for communication with the clients and senior management.
These charts can be used to present the important events, targets, and goals of a project to the high-level management and clients.
Milestones usually represent the initiation or completion of important deliveries, key activities, approval dates, or reviews. Thus, milestones in Gantt charts can be an ideal tool to plan and manage projects by displaying the key events in chronological order according to the schedule.
These milestones can be shown in different colors to indicate the status of the milestones leading to the completion of the project.
Agile Gantt Chart Template
Agile Gantt charts are bar charts that give a timeline view of Agile projects. On the left side of the chart, a vertical list of tasks along with the corresponding start and end dates is given.

The right side also has a visual representation of these tasks with horizontal bars. The length of these horizontal bars corresponds to the time required for the completion of the task.
Teams can use agile charts to break down large Agile events into smaller stories and tasks which helps them to efficiently manage the Agile workflow. Using Agile Gantt charts, teams can plan the schedule of their projects, spot the potential bottlenecks and give the deliverables to the client on due time.
Download: Document Tracker Template
Since Agile projects can change quickly, it is important to have an adaptable Gantt chart so that the deadlines can be adjusted quickly and team members can be reassigned if necessary. A Gantt chart is very similar to an Agile dependency diagram but is more detailed and focuses mainly on the time required for the completion of an Agile project.
What are the Benefits of a Gantt chart?
-
Visibility
Agile Gantt chart offers a snapshot of the project allowing the manager and team to have a clear overview of the project and share it with the stakeholders or clients.
-
Flexibility
Gantt charts are flexible because they can be changed without any major disruption. Dates, as well as milestones in Gantt charts, can be easily moved. Thus, the timelines of the project can reflect the changing priorities of the client.
-
Simplicity
Gantt charts break down complex Agile projects into simpler pieces or user stories. Thus, all the data can be stored in the form of tasks or subtasks but can be viewed or processed easily using a Gantt chart.
Construction Gantt Chart
Construction projects have been used to build important buildings like schools, airports, hospitals, etc. construction management is a kind of professional service that used advanced project management theories to design, plan and construct a building.
The manager handles the budget, project timeline, inspection, quality assurance, safety record, risk management, and so on. Thus, time management, as well as task management, are very important factors for the management of construction projects. construction Gantt charts help the managers to manage different tasks and their relationships.
A Construction Gantt chart shows a clear visual and color-coded bar-based presentation of the breakdown of individual tasks within a timeframe.
The vertical axis in this chart represents the tasks that need to be completed while the horizontal axis represents the time sequence.
Gantt charts can be used by construction project managers to adjust the relationships between tasks, update the progress, assign resources, manage the task periods, insert milestones and generate cost reports, etc. thus, construction Gantt charts offer a network-based on logical developments towards the completion of a task.
Work Breakdown Structure Gantt Chart
Work breakdown structure (WBS) is an important element of project management which enables the project manager as well as his team to break down the assigned tasks of the project into chunks so that they can be easily managed. In the WBS Gantt chart, all parts of the project are displayed in the form of an organized chart.

As the Work breakdown structure helps to create scope of the project, plan the schedule of different activities related to the project, allocate the resources and manage the risks associated, it allows the manager to easily manage the project by planning and scheduling the tasks and projecting them against time in a graphical form.
The integration of the WBS Gantt chart into your project will assist in creating a bar chart that tracks tasks across time; it will visually display the start and finish date of each task and the relationship between the tasks of the project thereby ensuring thorough project management.
The work breakdown structure, as well as the Gantt chart, play a vital role in project planning as the successful completion of any project depends on having the goals clearly defined and achieving them by the due date.
The objective of the project as well as the schedule have an impact on the cost of the project and labor needed among other variables so, it is very important to get them right.
In the Gantt chart, the use of WBS allows the manager to see his project properly by visualizing the workflow. Thus, by using WBS, more work can be done in a shorter time. it also allows to keep track of the project plan, view the critical path of the activities, and view the task dependencies.
WBS in Gantt chart also allows maximizing productivity by tracking the allocation of resources and spotlighting the potential issues in bar charts so that they can be fixed before they can change the deadlines.
This helps to identify the WBS tasks which is the list of tasks that the manager and his team need to complete to deliver the scope of the project. This is also useful for estimating the schedule as well as the cost of the project.